Experiments
Evidence that the heuristics actually optimize, not just run: every heuristic on every benchmark of the suite, with the same objective budget, over many seeds.
uv run python -m experiments.runner                      # results only
uv run --group experiments python -m experiments.report  # table + plots
experiments/ lives outside the installable package. runner.py needs
only the library and writes experiments/results/runs.csv (one row per
run) and summary.json (aggregates and mean convergence curves);
report.py rewrites the table below and, if matplotlib (optional
experiments dependency group) is installed, the PNG plots.
Protocol
- Budget:
max_evaluations(2000)for every run, so heuristics are compared at equal objective cost. The GA checksstoponce per generation and may overshoot by one generation; with a population of 10 it lands exactly on 2000 here. - Seeds: 20 per (benchmark, heuristic),
0..19. The seed drives the heuristic'srng, whichgeneratealso draws from. - Metrics: final best value,
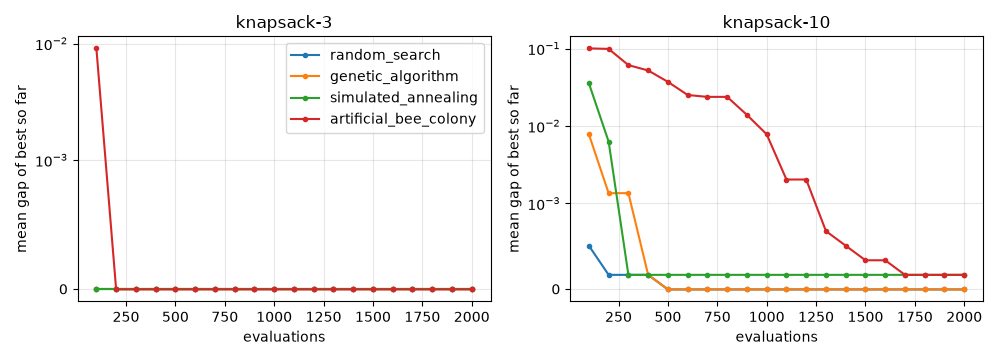
gap(benchmark, value)(0 = optimal; absolute for the continuous optima at 0), success rate (final gap <= 1e-3), evaluation count, wall time, and the gap of the best-so-far at 20 evenly spaced evaluation counts (convergence curve). The curve is recorded by wrappingevaluate, so it is in evaluations for every heuristic regardless of the shape ofresult.history.
Configurations
| Family | SA move / GA mutation | GA crossover | SA T0 |
|---|---|---|---|
| knapsack | bit_flip_neighbor |
single_point_crossover |
50 |
| tsp | two_opt_neighbor |
pmx_single_point |
1 |
| continuous | gaussian_neighbor (local, sigma 0.1, one coordinate, clipped) |
single_point_crossover |
10 |
- Random search (local baseline in
experiments/runner.py): fresh feasible solutions fromproblem.generateuntil the budget is spent. - Genetic algorithm: library defaults (population 10; each generation breeds 10 children from repeatedly selected parent pairs, weighted selection, the best genome so far kept by elitism); the SA neighborhood is adapted as a mutation.
- Artificial bee colony: 10 food sources (the GA's population size), a source is abandoned after 20 failed attempts, and the same moves as SA and the GA.
- Simulated annealing: geometric cooling from T0 to T0/1000 over the budget (one evaluation per iteration). T0 is set to the order of a typical worsening move for the family, not tuned per instance.
The library has no float operators, so gaussian_neighbor lives in
experiments/ rather than expanding the package.
Results
| Benchmark | Heuristic | Gap mean | Gap std | Gap min | Gap max | Best value | Success | Evals | Time (ms) |
|---|---|---|---|---|---|---|---|---|---|
| knapsack-3 | random_search | 0 | 0 | 0 | 0 | 220 | 100% | 2000 | 16.7 |
| knapsack-3 | genetic_algorithm | 0 | 0 | 0 | 0 | 220 | 100% | 2000 | 17.6 |
| knapsack-3 | simulated_annealing | 0 | 0 | 0 | 0 | 220 | 100% | 2000 | 11.5 |
| knapsack-3 | artificial_bee_colony | 0 | 0 | 0 | 0 | 220 | 100% | 2014 | 9.3 |
| knapsack-10 | random_search | 0 | 0 | 0 | 0 | 295 | 100% | 2000 | 37.6 |
| knapsack-10 | genetic_algorithm | 0 | 0 | 0 | 0 | 295 | 100% | 2000 | 23.9 |
| knapsack-10 | simulated_annealing | 0.0001695 | 0.0007388 | 0 | 0.00339 | 295 | 95% | 2000 | 13.9 |
| knapsack-10 | artificial_bee_colony | 0.0001695 | 0.0007388 | 0 | 0.00339 | 295 | 95% | 2013 | 13.3 |
| tsp-ring8 | random_search | 0.09723 | 0.08795 | 0 | 0.1768 | 8 | 45% | 2000 | 19.4 |
| tsp-ring8 | genetic_algorithm | 0 | 0 | 0 | 0 | 8 | 100% | 2000 | 26.3 |
| tsp-ring8 | simulated_annealing | 0 | 0 | 0 | 0 | 8 | 100% | 2000 | 18.8 |
| tsp-ring8 | artificial_bee_colony | 0 | 0 | 0 | 0 | 8 | 100% | 2012 | 16.8 |
| tsp-grid9 | random_search | 0.04663 | 0.05558 | 0 | 0.1502 | 9.414 | 55% | 2000 | 19.9 |
| tsp-grid9 | genetic_algorithm | 0 | 0 | 0 | 0 | 9.414 | 100% | 2000 | 26.9 |
| tsp-grid9 | simulated_annealing | 0 | 0 | 0 | 0 | 9.414 | 100% | 2000 | 19.4 |
| tsp-grid9 | artificial_bee_colony | 0 | 0 | 0 | 0 | 9.414 | 100% | 2008 | 17.0 |
| sphere-5 | random_search | 2 | 0.9487 | 0.5834 | 4.102 | 0.5834 | 0% | 2000 | 10.1 |
| sphere-5 | genetic_algorithm | 8.543e-05 | 6.134e-05 | 9.306e-06 | 0.0002882 | 9.306e-06 | 100% | 2000 | 17.0 |
| sphere-5 | simulated_annealing | 0.00443 | 0.002656 | 0.0007336 | 0.01068 | 0.0007336 | 10% | 2000 | 11.5 |
| sphere-5 | artificial_bee_colony | 0.6966 | 1.016 | 6.726e-05 | 3.415 | 6.726e-05 | 20% | 2010 | 9.0 |
| rastrigin-5 | random_search | 22.04 | 3.987 | 11.93 | 27.22 | 11.93 | 0% | 2000 | 10.9 |
| rastrigin-5 | genetic_algorithm | 13.44 | 5.552 | 3.989 | 25.87 | 3.989 | 0% | 2000 | 18.3 |
| rastrigin-5 | simulated_annealing | 41.7 | 24.22 | 2.996 | 99.51 | 2.996 | 0% | 2000 | 12.9 |
| rastrigin-5 | artificial_bee_colony | 12.59 | 6.483 | 3.058 | 25.41 | 3.058 | 0% | 2002 | 10.2 |
Findings
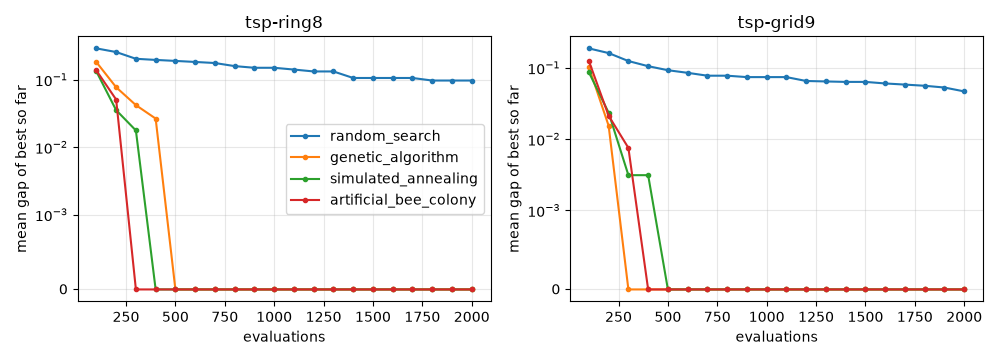
- TSP: GA and SA both solve it. Both reach the optimum in all 20 seeds on both instances, each within ~300-400 evaluations; random search is still 5-10% off on average after 2000.
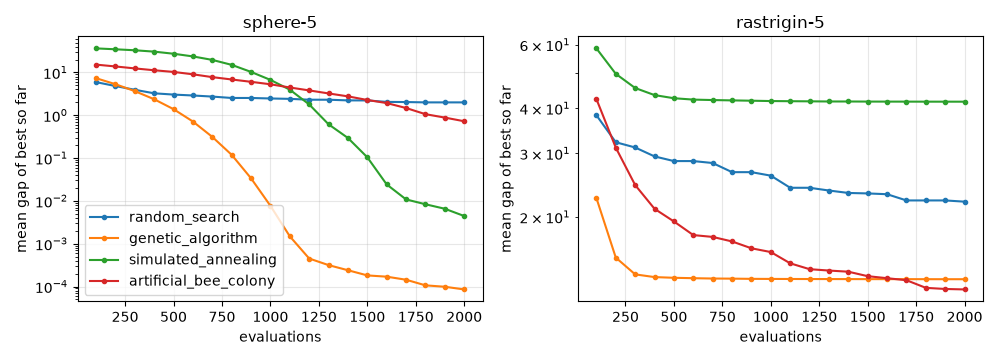
- Sphere: the GA wins (mean gap ~8e-5, 100% success) over SA (~4e-3, 10% success). Every generation mutates all 10 children with a 0.1 step and keeps the best, so the population drifts steadily downhill; SA spends its high-temperature first half wandering (its curve starts worst) and its fixed sigma of 0.1 is too coarse for the last steps.
- Rastrigin: nobody gets near the optimum with this budget. The GA and ABC have the best mean gaps (~13 each vs ~22 random, ~42 SA); the GA stalls after ~300 evaluations: with only 10 genomes, elitism and fitness-weighted selection, the population collapses onto one basin within a few generations and 0.1 steps cannot leave it (premature convergence; its std ~6 reflects which basin each seed lands in). SA freezes in a local minimum for the same step-size reason, but is high-variance: its best seed (gap ~3) is the best overall.
- The GA used to be ~random search. Before #49 each generation kept
only 2 parents + 2 children and refilled the other 6 of 10 genomes with
fresh random ones, so most of the budget was random sampling (TSP gaps
0.07 / 0.03, sphere gap 1.6, rastrigin 20). Breeding the whole
population and scale-invariant selection weights (the old
max - v + 1weights were nearly uniform on small-range continuous values) fixed it. - Artificial bee colony: strong on TSP, middling on continuous. It
solves both TSP instances on every seed. On sphere its mean gap (~0.7,
20% success) beats random search (2) but is far behind the GA and SA.
Changing
limit(20 to 1000) makes no difference; a colony of 5 instead of 10 sources gives ~0.1, so the budget seems spread too thinly over the sources for the fixed 0.1 step (observed, not proven). On rastrigin it has the best mean gap by a hair (~12.6 vs ~13.4 GA, ~22 random), thanks to scouts restarting in new basins. It is also the fastest per run. Parameters are not tuned per instance. - Knapsack does not discriminate.
knapsack-3has 8 packings andknapsack-101024, fewer than the budget, so random search is 100% successful. SA is sensitive to T0 here: a first run with T0 = 10 (below the item values, 4-120) trapped SA in local optima (40% / 20% success); T0 = 50 gives 100% / 90%. Harder instances are needed to say more. - Time: every run takes ~10 to ~30 ms; the GA is the slowest per evaluation (selection runs once per parent pair, plus crossover and feasibility bookkeeping), ABC and SA the fastest.
Termination metadata
All the heuristics run on core.run, so metadata['termination'] is
'stop' and metadata['state'] the final State for each (the GA used to
store the State itself; the runner no longer normalizes it). The
termination column of runs.csv is copied as is.